One of the most critical pieces of any audit and one of the operational bridges between accounting theory and system enforcement is Audit Sampling. In this article I want to explore a technical implementation of Canadian Auditing Standard (CAS) 530, AICPA Audit Standards Clarified (AU-C) 530 and PCAOB Auditing Standard (AS) 2315, which are better known as Audit Sampling. This article also touches on International Standards on Auditing (ISA) 530 which is how CAS 530 and AU-C 530 were derived.
All varieties of stakeholders will face challenges when they are trying to extract, stratify, and statistically sample thousands and for some enterprises, millions of general ledger entry records without introducing non-sampling risk or population incompleteness. This is highly important for finance teams when preparing for an external audit and a test of internal controls.
With Business Central Excel features or OData Web Services and Power Query, CFO’s, Corporate Controllers, Internal/External Auditors, Business Central Consultants, and finance teams can automate these checks and sampling to help build a robust audit trail that complies with CAS 530, AU-C 530 and PCAOB AS 2315.
Theoretical Framework
The regulatory audit sampling framework across North America is divided by jurisdiction and entity structure, yet related by some underlying principles and a common harmonization.
CAS 530 and AU-C 530 Similaritites
The most harmonization between the 3 standards is between the Canadian Auditing Standards (CAS 530) and the US AICPA AU-C 530 which is applicable to US Private Entities. Both these standards are nearly identical in requirements as they are derived from ISA 530. Under both of these standards there are a few common definitions:
- Sampling: Application of Audit Procedures to less than 100% of items within a population of audit relevance such that all sampling units have a chance of selection, providing the auditor with a reasonable basis for conclusions.
- Sampling Risk: The risk that the auditor’s conclusion based on a sample may differ from the conclusion reached if the entire population were subjected to the same audit procedure.
- Sampling Unit: The individual items making up a population, such as specific checks, individual invoices, or ledger balances.
There are also two kinds of sampling risk related to Audit Effectiveness and Audit Efficiency.
- Risk of Incorrect Acceptance: In a test of controls, concluding that controls are more effective than they actually are; or in a substantive test of details, concluding that a material misstatement does not exist when it does. This risk directly impairs audit quality and is the primary concern for regulators.
- Risk of Incorrect Rejection: Concluding that controls are ineffective or that a material misstatement exists when it does not. This leads to unneeded audit procedures and inefficiency.
There are also non-sampling risks that can be considered such as incorrect/incomplete data, human error, and applying the wrong procedures tests.
PCAOB AS 2315 Differences
I won’t go into many technical details, but I wanted to highlight some key differences. First, any Publicly Traded Companies, Big Banks and SEC Issuers needs to follow PCAOB AS 2315. While fundamentally there are a lot of similarities the few differences (but not all) to keep in mind which includes:
- Dual-Purpose Testing: A dual-purpose test uses the exact same sample to test a control (attribute sampling) and a dollar balance (substantive testing) simultaneously. Because public issuers carry lower risk tolerance, AS 2315 requires the sample size to be the larger of the samples that would have been designed for the separate purposes.
- Integrated Internal Control Over Financial Report Precision: Control failures identified in sample testing can have downstream impacts and can’t be dismissed without adjusting substantive sample sizes. Under AU-C 530, private companies rarely require an independent opinion on the operating effectiveness of controls and sampling is used primarily to assess control risk.
- Tolerable Misstatement Evaluation: Tolerable misstatement is the maximum monetary error an auditor will accept in an account balance without declaring it materially misstated. AS 2315 places greater emphasis on evaluating the statistical upper limit of misstatement when sample results approach the tolerable misstatement threshold.
The main thing is that PCAOB AS 2315 has more restrictions, but these are things auditors manage and when it comes to automating steps in Business Central the implementation will be very similar.
Standard Sampling Methods
Both CAS 530 and AU-C 530 outline five standard methods for selecting sample item from a population. The methods are a mix of statistical and non-statistical methods as follows:
| Selection Method | Core Standard Mechanism |
| Random Selection | Selection using random number generators ensuring every sampling unit has an equal chance of selection. |
| Systematic Selection | Dividing population N by sample size n to get interval k (N/n), selecting every k-th item from a random start. |
| Monetary Unit Sampling (MUS) | Value-weighted selection where every individual dollar in the population acts as a sampling unit. Larger amounts are more likely to be selected. |
| Haphazard Selection | Selecting items without following a structured technique, attempting to avoid conscious bias. This isn’t permitted for statistical sampling. |
| Block Selection | Selecting contiguous transactions (e.g., all entries in March). Rarely appropriate for audit sampling due to seasonality. This is a non-statistical sampling method. |
Business Central Implementation
There are two main ways to manage and execute audit sampling in Business Central. One way is to use the Open in Excel feature, but another way is to utilize some Business Central APIs in the web service page which can be fed directly into reporting tools such as Power BI. This makes the process of sampling and analysis simple across entities and environments whereas with Open in Excel you need to run the same process manually in each entity and environment which can be prone to errors.
In the steps below I will focus on sampling for my Accounts Receivable balance, specifically Invoices.
Step 1: Connect your Business Central Data to Excel with Power Query
In my scenario I am going to pull data using Power Query, but you could just as easily run other reports for the Trial Balance Detail or simply open a page in excel. To start I first need to get my OData URL from the Web Services page in Business Central. Web Services, simply put, is the way that Business Central manages it’s API or it’s how you can get data out of and into Business Central. It’s a highly powerful tool for reporting and integrations. In this scenario I just want two Objects, my G/L Entries and Cust. Ledger Entries and just my invoices, although you could test Credit Memos and Payments separately:

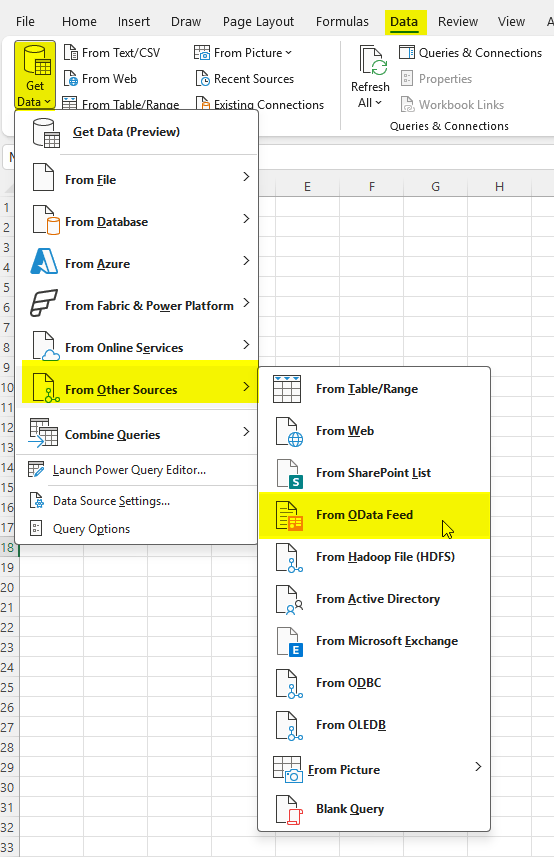
Once I note down the OData V4 URL’s I can take those to excel and use Power Query to pull data from those tables. To do this in excel just select Data > Get Data > From Other Sources > From OData Feed:
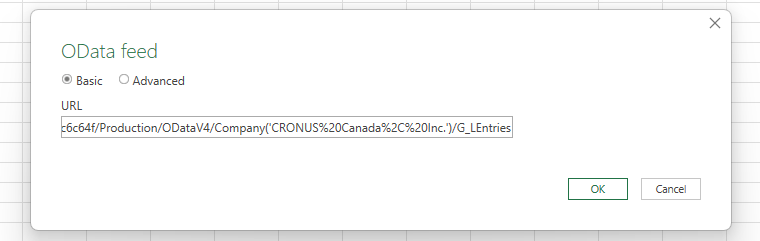
Then enter your OData URL:
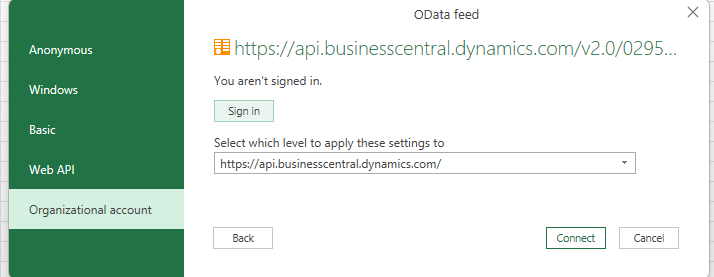
It will then prompt you to login, I recommend logging in with an Organizational Account which will be your Business Central login:
Once you login and connect to your data you will see a data preview showing you successfully connected:
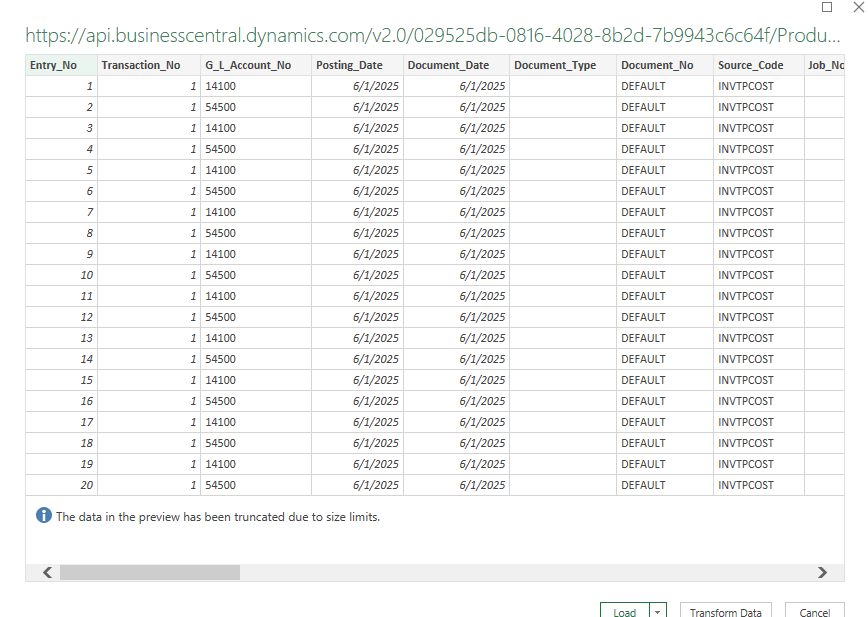
Once you select Load it will dump that data into excel, you can repeat that step for as many web services as you need:
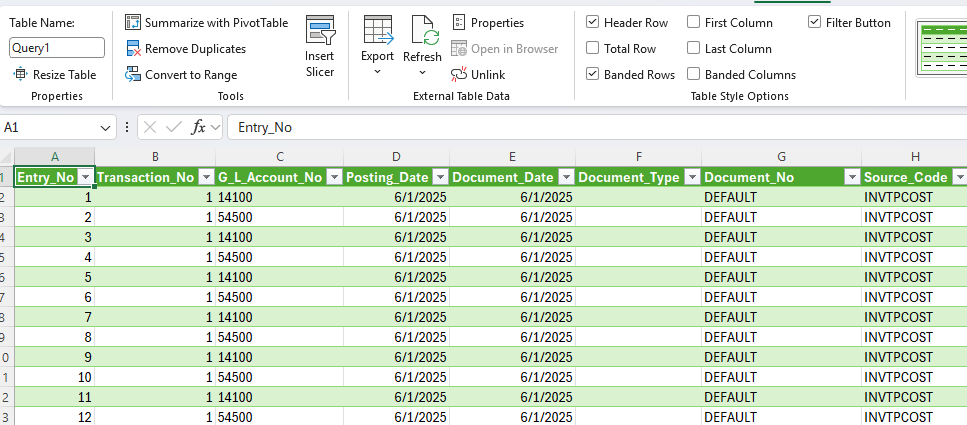
To really take advantage of the power of power query you can get started by selecting Data > Get Data > Launch Power Query Editor…
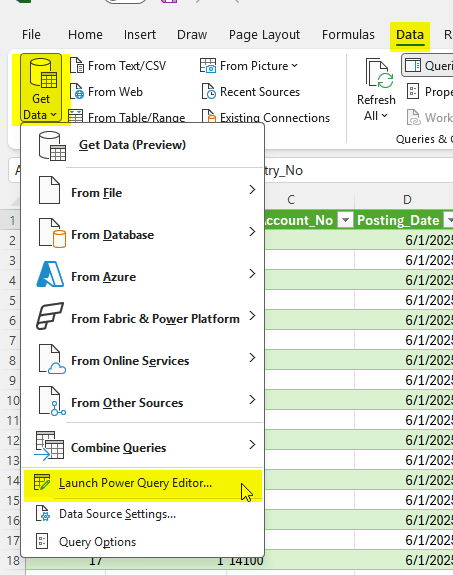
Some of the things we can do within that editor I will cover further in this article.
Step 2: Proving Population Completeness in BC (CAS 530.A5)
Paragraph A5 of CAS 530 clearly outlines that “The auditor is required to obtain evidence that the population is complete and accurate before drawing a sample.” To verify Completeness in Business Central I would follow the below steps.
First: In order to build our sample and ensure we have accurate data we have to start with getting a trial balance for the fiscal period, there are a lot of ways to do this but in my case, I will run the standard Trial Balance for a date range of January 1st, 2026, to December 31st, 2026, with Net Change and Balances:
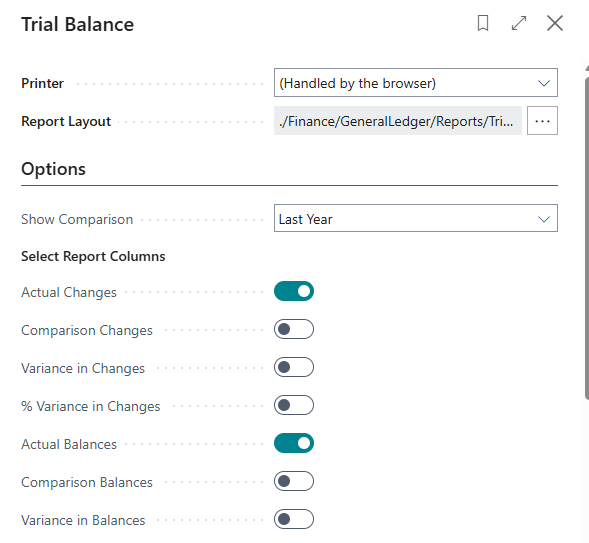
This will give me my summary Trial Balance where I can note down my balances for each account with a focus on the Accounts Receivable amount:
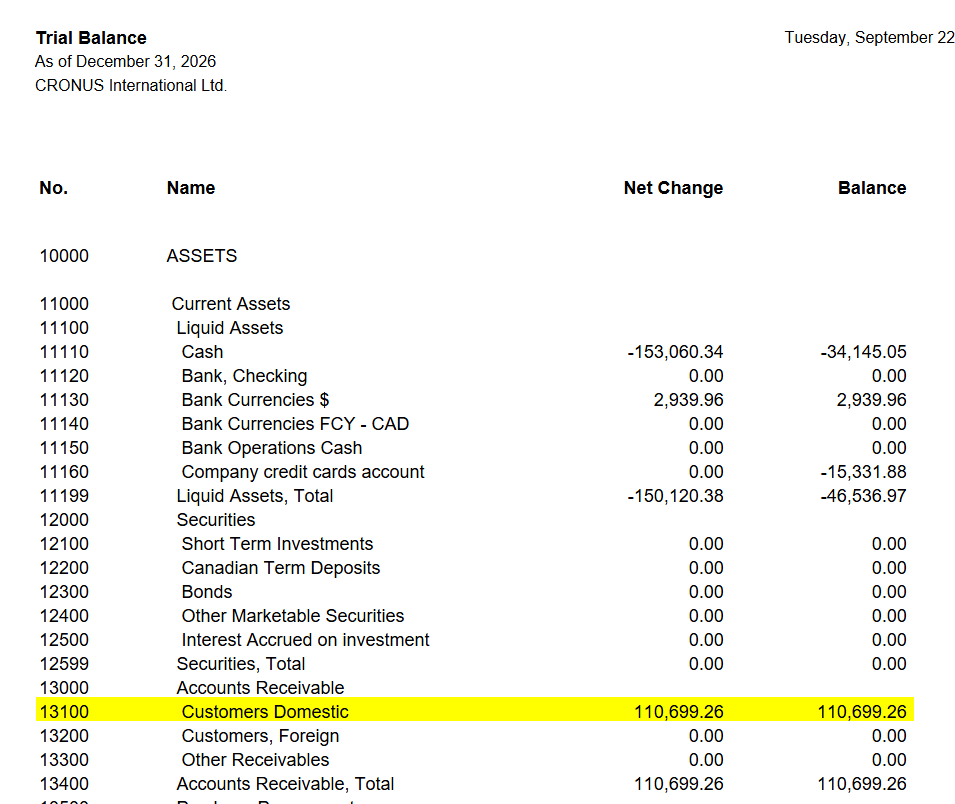
That’s my number that will validate my completeness check. Next, I can look at the data from the tables in the system such as in Step 1, but some other tables you may need includes but is not limited to:
- General Ledger Entries
- Vendor Ledger Entries
- Customer Ledger Entries
- Posted Invoices (Sales and Purchase)
- Bank Account Ledger Entries
- Check Ledger Entries
- Other ledger entries tables as needed
Second: Let’s look at my detailed data from my query in excel, both my G/L Entries and my Customer Ledger Entries must match that trial balance amount in order for me to validate completeness. In the Power Query Editor, I can preset filters for the date range I want (and other fields if necessary) just like I am creating filters on any excel table making it intuitive and easy to use, my steps for changes to my query are documented on the right panel under Query Settings:

Once I make all my changes for filtering, naming, and other settings I can save those changes and then easily review my data in excel. If I sum my customer ledger entries, I should see a match with the trial balance which I fortunately have here:
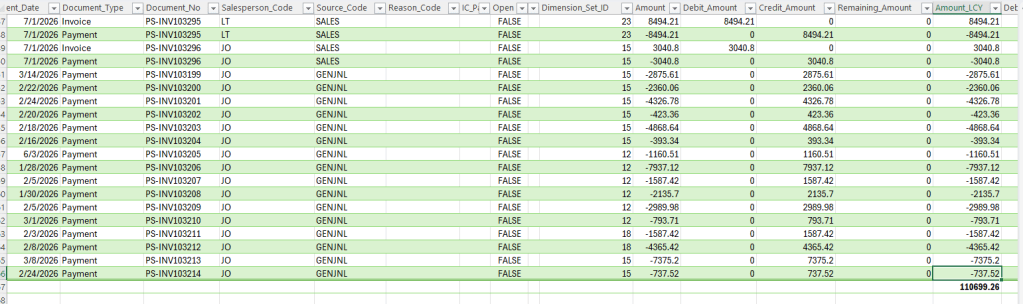
I can then repeat that for any other data set I have. In this case I would also validate my G/L Entries.
Step 3: Stratification by Materiality & Risk (CAS 530 Appendix 1)
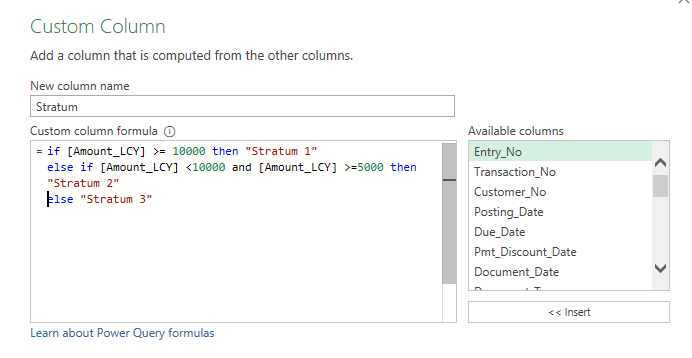
CAS 530 Appendix 1 highlights that stratifying a population by item value or risk reduces variability, enabling smaller overall sample sizes without increasing sampling risk. In the Power Query Editor, I can add dynamic conditional columns to divide the population into three strata:
- Stratum 1 (100% Examination): All individual items exceeding Performance Materiality (PM) (e.g., items > $10,000). These entries are tested 100% regardless of sampling.
- Stratum 2 (Key / High-Risk Items): Items between 50% PM and 100% PM, or flagged with specific risk dimensions (e.g., manual G/L entries posted on weekends). Tested based off professional judgement.
- Stratum 3 (Remaining Residual Population): The residual population below 50% PM, subject to statistical sampling (e.g., Monetary Unit Sampling).
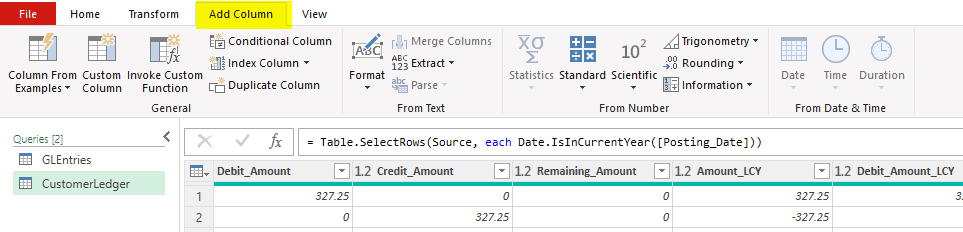
To add this column simply just click on Add Column in the ribbon and then add a Custom Column or a Column from an example. This is where Power Query complexity increases but if you’re familiar with excel formulas you can pick it up in no time:
And my formula for a new column would be a simple nested if statement (make sure with decimal values to just use the number itself, no commas):
That then adds a new column with each stratum:
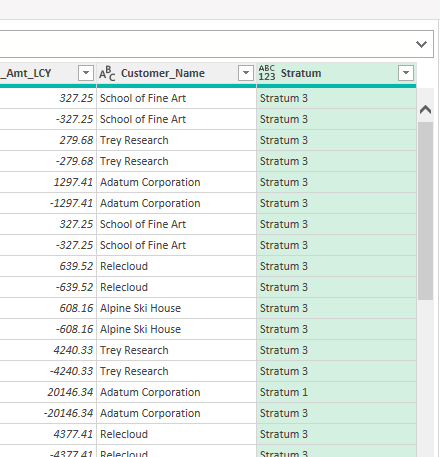
After that I can review anything in Stratum 1 that needs to be reviewed in detail:
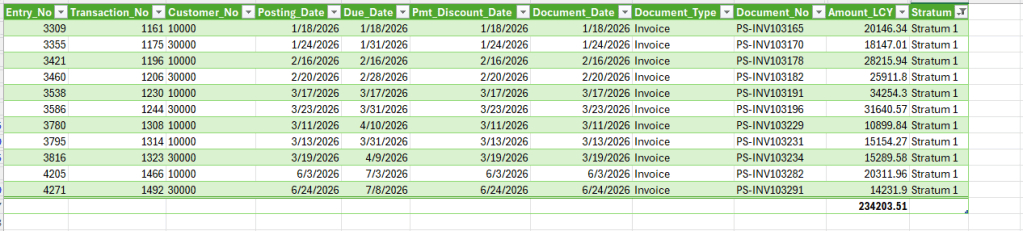
I can repeat this step for Stratum 2 by flagging certain risk factors that may stand out such as who posted it, when it was posted, and which customer it was for.
You could also create a single query for each Stratum just by duplicating that query made previously and saving a filter under your query within the power query editor.
Step 4: Executing Monetary Unit Sampling (MUS) in Power Query
Monetary Unit Sampling (MUS) is the gold standard for substantive testing under CAS 530 and AU-C 530. MUS treats each individual dollar as a sampling unit, ensuring higher-dollar Business Central transactions have a proportionally higher probability of selection.
To execute MUS in Power Query for Stratum 3:
- Sort and Filter Population: Sort the filtered BC dataset by Amount descending and Filter by Stratum 3.
- Calculate Cumulative Running Total: Add a custom column calculating the running cumulative sum of transaction amounts. This can simply just be done in the excel spreadsheet using an Amount + Running Total column seen in Cell AB below:

- Determine Sampling Interval (k): Calculate Sampling Interval k = Total Stratum Dollar Value / Target Sample Size (n). In my scenario this is a total of 193,864$ for Stratum 3 and my target sample size will be based off professional judgement. In this scenario I will set a sample size of 50 as my sample data is quite condensed. This will mean Interval k will = 3,877.28
- Select Sample Items: Select transaction records where the cumulative total crosses each interval threshold (k, 2k, 3k, …). This is where it gets a bit trickier, but you can capture this with a simple excel formula given you add a few columns:
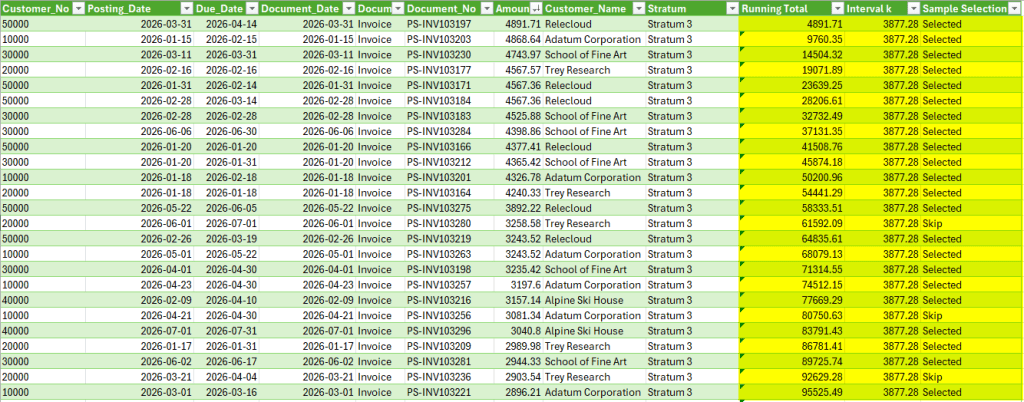
Running Total = Amount + Running Total (exception for the first row where it just = Amount)
Interval k = What was calculated above in our formula of Total Stratum Dollar Value / Target Sample Size
Sample Selection (excel formula) = IF(INT(Running Total/Interval k) > INT((Running Total – Amount) /Interval k), “Selected”, “Skip”) – Note that you can use any formula you like, you may run into boundary calculation issues. I use INT formulas to calculate integer interval buckets as an index; AI tools are great for helping with building formulas if you are ever unsure.
The sample selection cell isn’t perfect but it’s performing a check on the Running Total divided by Interval k and seeing if that calculation is greater than the difference of the running total and amount divided by interval k. Just a quick simple way to see if a value needs to be sampled and have that sample weighted by the dollar amount with higher dollar amounts more likely to be selected.
This then results in a sample we can use for review with the data we want to investigate highlighted under “Selected”. This should equal or be close to our target sample size.
Step 5: Evaluating Sample Results & Projecting Misstatements (CAS 530.14)
Under CAS 530.14 and AU-C 530.14, for substantive tests of details, the auditor is required to project misstatements found in the sample to the population.
For Monetary Unit Sampling, the projected misstatement is calculated using the tainting percentage which is comprised of a Book Value and Audit Value amounts:
Book Value = Amount in the Customer Ledger Entry (or other ledger entry) table
Audit Value = Amount reviewed and inspected from original documents (posted invoices and shipments)
Tainting Percentage = (Book Value – Audit Value) / Book Value
If there is no gap and Book Value = Audit Value, then the Training Percentage is 0%. If we have a tainting percentage then we can calculate a Projected Misstatement based on the following:
For sample items where amount is < Sampling Interval (k):
Projected Misstatement = Tainting Percentage × Sampling Interval (k)
For sample items where amount is ≥ Sampling Interval (k):
Projected Misstatement = Actual Dollar Misstatement
Total Projected Misstatement = Sum of Projected Misstatements across all sample items.
These values can simply be added as formulas or columns to excel and power query similar to how we added other fields before if there happens to be a misstatement. All these values and formulas can be repeated across Business Central companies and environments.
Closing Thoughts
Audit sampling is no longer a manual, disconnected exercise involving static Excel spreadsheets and fragmented data extracts. By aligning CAS 530 and AU-C 530 statistical requirements directly with Dynamics 365 Business Central OData Web Services, finance teams and auditors can utilize Power Query tools to create automated analytical tools to save time while sampling data.
By implementing automated population completeness checks, systematic stratification, and Monetary Unit Sampling (MUS) via Power Query, Controllers, Auditors, Finance Teams and Consultants can ensure their workpapers align with the highest level of regulatory scrutiny under Canadian, AICPA, and PCAOB standards.


Leave a comment